Congress Stock Trading in 2025: What 14,060 House Stock Trades Show
Congress stock trading in 2025 was far bigger, and far more concentrated, than most public tallies suggest. Reading every Periodic Transaction Report the House Clerk published for the year, including the paper filings that arrive as scanned images, we counted 14,060 House stock trades with a 2025 transaction date, filed by 113 members. Four members account for 8,306 of them, or 59.1%. Ten members account for 11,103, or 79.0%. One member alone, Rep. Ro Khanna (D-CA), reported 4,859 trades, which is 34.6% of every House stock trade in the year.
The rest of the record points the same way. 76.8% of trades sit in the smallest reporting band, $1,001 to $15,000. 71.6% were made in accounts belonging to a spouse, a dependent child, or held jointly rather than by the member alone. 8.2% were filed more than 45 days after the trade, the outer limit the STOCK Act sets for reporting. And in the four trading days of the April 2025 tariff selloff, House members reported 786 trades, with sales outnumbering purchases 443 to 343.
An earlier version of this study, published the same day, counted 2,243 House trades from 71 members. That dataset relied on a third-party copy of House filings that skipped paper (scanned) reports and dropped rows from long electronic reports. We rebuilt the 2025 record directly from the House Clerk, transcribed every scanned filing, and rewrote every figure below. Several earlier conclusions changed, most visibly the April tariff week, which in the full record leaned toward selling, not buying.
Every figure below was computed directly from the transaction records, and each record links to its original filing on the House Clerk's disclosure site. The method, including what we excluded and why, sits in the methodology section at the end. Readers who want to follow individual members can open each profile on the congressional trading tracker, and the congressional trading leaderboard ranks members by activity.
Congress Stock Trading in 2025: The Full-Year Numbers
The House of Representatives seats 435 voting members plus non-voting delegates. In 2025, 113 of them reported at least one stock trade with a 2025 transaction date. Together they filed 14,060 transactions across 2,586 distinct securities. Purchases made up 7,010 of the trades, sales made up 7,024, and 26 were reported as exchanges. Put another way, 49.9% of the year's House stock trades were buys, an almost perfect split. As a group, the House was rebalancing in both directions all year rather than piling into one side of the market.
| Measure (House, transactions dated 2025) | Value |
|---|---|
| Stock trades reported | 14,060 |
| Members with at least 1 trade | 113 |
| Distinct securities traded | 2,586 |
| Purchases / sales / exchanges | 7,010 / 7,024 / 26 |
| Trades in the $1,001 to $15,000 band | 10,794 (76.8%) |
| Midpoint estimate of disclosed value | about $664.2 million |
| Median days from trade to filing | 27 |
The disclosed value deserves a caution before anyone quotes it. Members do not report exact dollar amounts. They report a band, such as $1,001 to $15,000 or $15,001 to $50,000. To produce a single figure we took the midpoint of each band and added them up, which gives about $664.2 million for the year. The true total could sit well above or below that line, because the bands are wide and the top band is open-ended. Treat it as an order of magnitude, not an audited sum.
The Senate is a different story. Senate stock trades dated in 2025 in our records number only 58, from 5 senators. Senators file through a separate electronic system that we are still rebuilding the same way, so this study covers the House only, and every headline figure says so.
Four Members, More Than Half the Trades
The clearest pattern in 2025 is concentration. If you lined up all 113 trading members by trade count, the first four would cover more ground than the remaining 109 combined, and the first member alone reported more trades than the next five combined.
| Member | Trades | Buys / Sells | Distinct securities | Midpoint value |
|---|---|---|---|---|
| Rep. Ro Khanna (D-CA) | 4,859 | 2,679 / 2,180 | 839 | $64.9M |
| Rep. Lisa C. McClain (R-MI) | 1,480 | 716 / 764 | 470 | $14.2M |
| Rep. Michael T. McCaul (R-TX) | 1,140 | 500 / 639 | 348 | $81.4M |
| Rep. Gilbert Ray Cisneros, Jr. (D-CA) | 827 | 492 / 332 | 375 | $22.4M |
| Rep. Rob Bresnahan (R-PA) | 648 | 278 / 370 | 333 | $8.3M |
| Rep. Jefferson Shreve (R-IN) | 627 | 200 / 425 | 320 | $180.9M |
| Rep. Julie Johnson (D-TX) | 583 | 116 / 464 | 237 | $4.8M |
| Rep. Josh Gottheimer (D-NJ) | 391 | 123 / 268 | 182 | $20.1M |
| Rep. Marjorie Taylor Greene (R-GA) | 288 | 285 / 3 | 86 | $4.8M |
Rep. Khanna's 4,859 trades touched 839 different securities. That profile, thousands of small tickets spread across hundreds of names, looks like professionally managed accounts rather than a handful of concentrated positions. Almost none of it is in his own name: 2,557 trades were reported for a spouse's accounts, 2,301 for dependent children's accounts and 1 for himself. Rep. Khanna files on paper, which is why datasets built only from electronic filings can miss him entirely. The filings do not say who places the orders, and this study makes no claim about it. What the numbers do show is that a single filer can move any "most active trader in Congress" ranking by himself, so rankings built on raw trade counts mostly measure account style.
Dollar value tells a different story. Rep. Jefferson Shreve reported 627 trades, about an eighth of Rep. Khanna's count, yet the midpoint value of his trades comes to about $180.9 million, the largest of any House member in 2025. Rep. Michael T. McCaul comes next at about $81.4 million across 1,140 trades. Count and value rank members very differently, and any story about "the biggest trader in Congress" has to say which one it means.
Rep. Marjorie Taylor Greene stands out for direction rather than size: 285 of her 288 reported 2025 trades were purchases, with only 3 sales, and her median filing came 3 days after the trade, the shortest median among the most active House traders.
At the other end of the distribution, 15 members reported exactly 1 trade for the whole year and another 30 reported between 2 and 5. Those 45 members are about 40% of everyone who traded, yet together they contributed 109 trades, less than 1% of the volume.
| Trades reported in 2025 | Members | Trades in group |
|---|---|---|
| 1 | 15 | 15 |
| 2 to 5 | 30 | 94 |
| 6 to 20 | 29 | 384 |
| 21 to 100 | 21 | 1,064 |
| 101 to 1,000 | 15 | 5,024 |
| More than 1,000 | 3 | 7,479 |
The Most-Traded Stocks in Congress in 2025
Ranking tickers by raw trade count would reward whichever stock a single high-volume account happened to rebalance most. A more useful question is which stocks drew the most separate members. Ranked that way, Microsoft and Apple tie for first in the House in 2025, each traded by 31 members.
| Ticker | Members trading it | Trades | Buys / Sells |
|---|---|---|---|
| MSFT (Microsoft) | 31 | 137 | 64 / 73 |
| AAPL (Apple) | 31 | 110 | 54 / 56 |
| AMZN (Amazon) | 27 | 126 | 81 / 45 |
| NVDA (Nvidia) | 23 | 141 | 99 / 42 |
| PG (Procter & Gamble) | 23 | 56 | 25 / 31 |
| AVGO (Broadcom) | 21 | 96 | 54 / 42 |
| GOOGL (Alphabet) | 21 | 49 | 20 / 29 |
| UNH (UnitedHealth) | 20 | 84 | 35 / 49 |
Nvidia is the most one-sided name near the top. Of the 141 Nvidia trades House members reported with 2025 transaction dates, 99 were purchases and 42 were sales, and 18 different members bought it. The Nvidia congressional trading story page tracks the newest filings on the stock. Amazon shows the same tilt, 81 buys against 45 sells. Those two names sit at the center of the AI and cloud build-out that dominated equity markets in 2025, and House members leaned into them on the buy side.
UnitedHealth leaned the other way. It drew 20 different members, but sales outnumbered purchases 49 to 35. UnitedHealth was one of the most volatile large-cap stocks of 2025, after the company suspended its guidance and its chief executive stepped down in May. The filings record the trade, not the reason.
One caution applies to every ticker count in this study. Paper filings usually list a company name without a ticker symbol, and we only attach a ticker when the filing prints one or the name matches a listed company exactly. 3,168 of the 14,060 trades carry no ticker, mostly from paper filers, so the ticker tables undercount members who file on paper.
Republican vs Democratic Trading Patterns in 2025
Democratic members reported 8,134 of the 14,060 House trades, or 57.9%. Republican members reported 5,926. The member counts run the other way: 64 Republicans and 49 Democrats reported at least one trade. The Democratic lead comes almost entirely from Rep. Khanna; without his 4,859 trades, the other 48 Democrats reported 3,275, about half the Republican total.
| Party | Members trading | Trades | Buys / Sells | Midpoint value | Most widely traded tickers |
|---|---|---|---|---|---|
| Democratic | 49 | 8,134 | 4,081 / 4,035 | $237.9M | AAPL (14 members), MSFT (13), PG (12), NVDA (11), AMZN (11) |
| Republican | 64 | 5,926 | 2,929 / 2,989 | $426.2M | MSFT (18 members), AAPL (17), AMZN (16), UNH (13), V (13) |
The ticker lists overlap more than partisan framing would suggest. Microsoft, Apple and Amazon sit near the top for both parties. The differences are at the edges: Democratic members traded Procter & Gamble and Nvidia more widely, Republican members UnitedHealth and Visa. Democratic members also traded Nvidia 91 times, more than any other ticker on either list.
Dollar value flips the trade-count picture. Republicans reported about $426.2 million in midpoint value and Democrats about $237.9 million, because several Republican members, led by Rep. Shreve and Rep. McCaul, traded in larger bands. On a dollars basis, Republican House members moved far more money in 2025, even while filing fewer trades.
Month by Month: When the House Traded in 2025
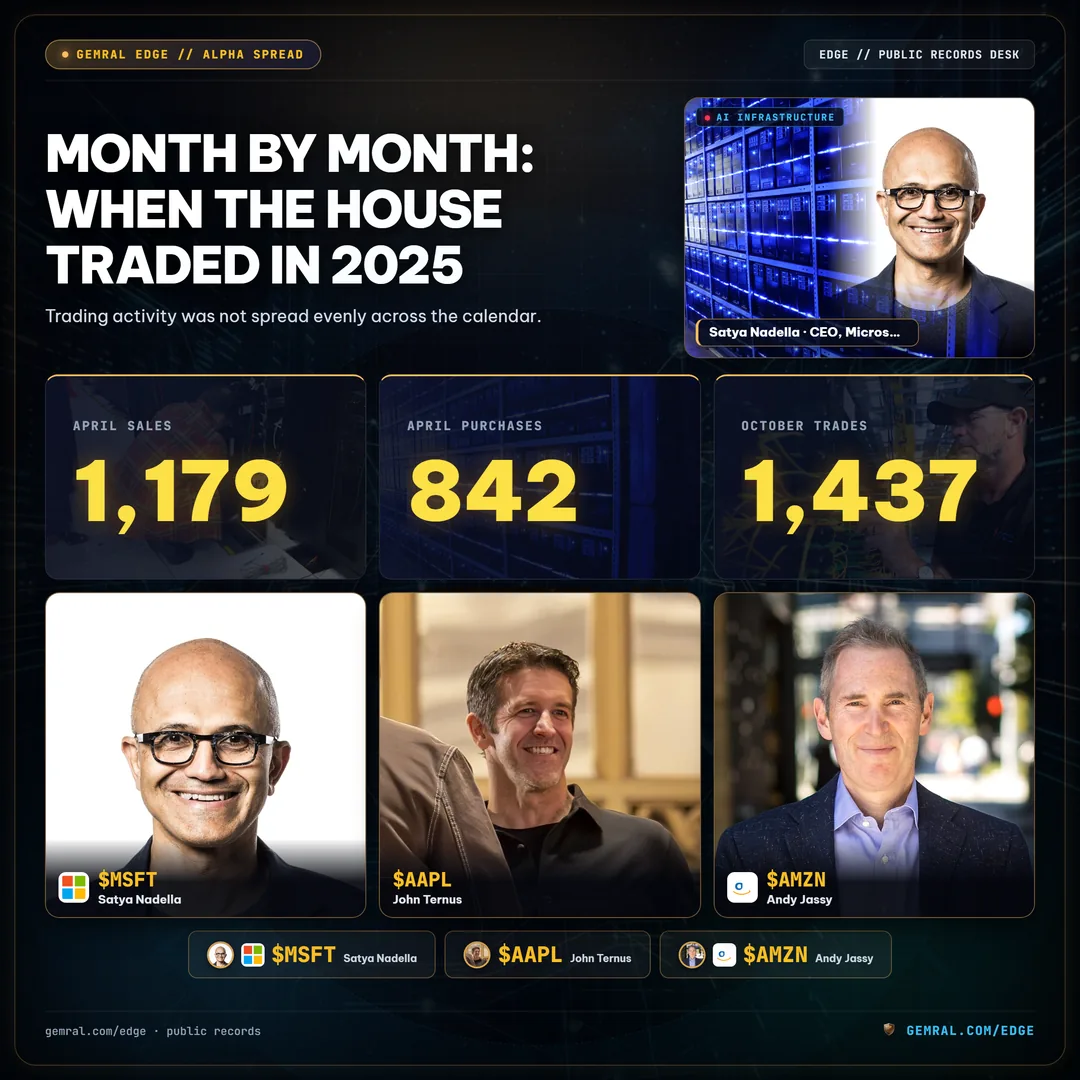
Trading activity was not spread evenly across the calendar. April 2025 was the busiest month by far, with 2,021 trades from 44 members, and it was a selling month: 1,179 sales against 842 purchases. October came second with 1,437 trades, and March third with 1,377. November was the quietest month of the year, with 789 trades from 30 members.
| Month (2025) | Trades | Buys | Sells | Members |
|---|---|---|---|---|
| January | 1,229 | 666 | 563 | 51 |
| February | 1,015 | 539 | 474 | 52 |
| March | 1,377 | 762 | 615 | 48 |
| April | 2,021 | 842 | 1,179 | 44 |
| May | 1,117 | 518 | 598 | 42 |
| June | 1,249 | 652 | 597 | 45 |
| July | 905 | 479 | 420 | 44 |
| August | 1,065 | 561 | 503 | 39 |
| September | 1,028 | 443 | 583 | 34 |
| October | 1,437 | 661 | 772 | 50 |
| November | 789 | 458 | 329 | 30 |
| December | 828 | 429 | 391 | 46 |
The buying months came early. January leaned toward purchases, 666 against 563, and March did the same, 762 against 615. The selling months clustered around market stress: April, May, September and October all showed more sales than purchases.
Between April 3 and April 8, 2025, the four trading days after the White House announced broad new tariffs on April 2 and before the 90-day pause was announced on April 9, House members reported 786 trades from 21 members. Sales outnumbered purchases 443 to 343. In the following week, April 9 to April 15, members reported 535 trades from 29 members, 200 purchases and 335 sales.
That April pattern is worth stating carefully, because it reverses what thinner datasets showed. In the full record, the members who traded during one of the sharpest market drops of the year were net sellers, and they kept selling after the pause. Our April total of 2,021 trades is also close to the count of 1,865 that newsroom tallies reported for the month. Three filers drove much of the tariff week: Rep. Khanna with 307 trades, Rep. Bresnahan with 183 and Rep. Shreve with 95. The filings do not show why any member traded, and selling into a falling market is also what a rules-based rebalancing account would be expected to do. The data supports the timing; it does not support any claim about motive.
Spouses, Joint Accounts and Dependents: Who Owns the Trade
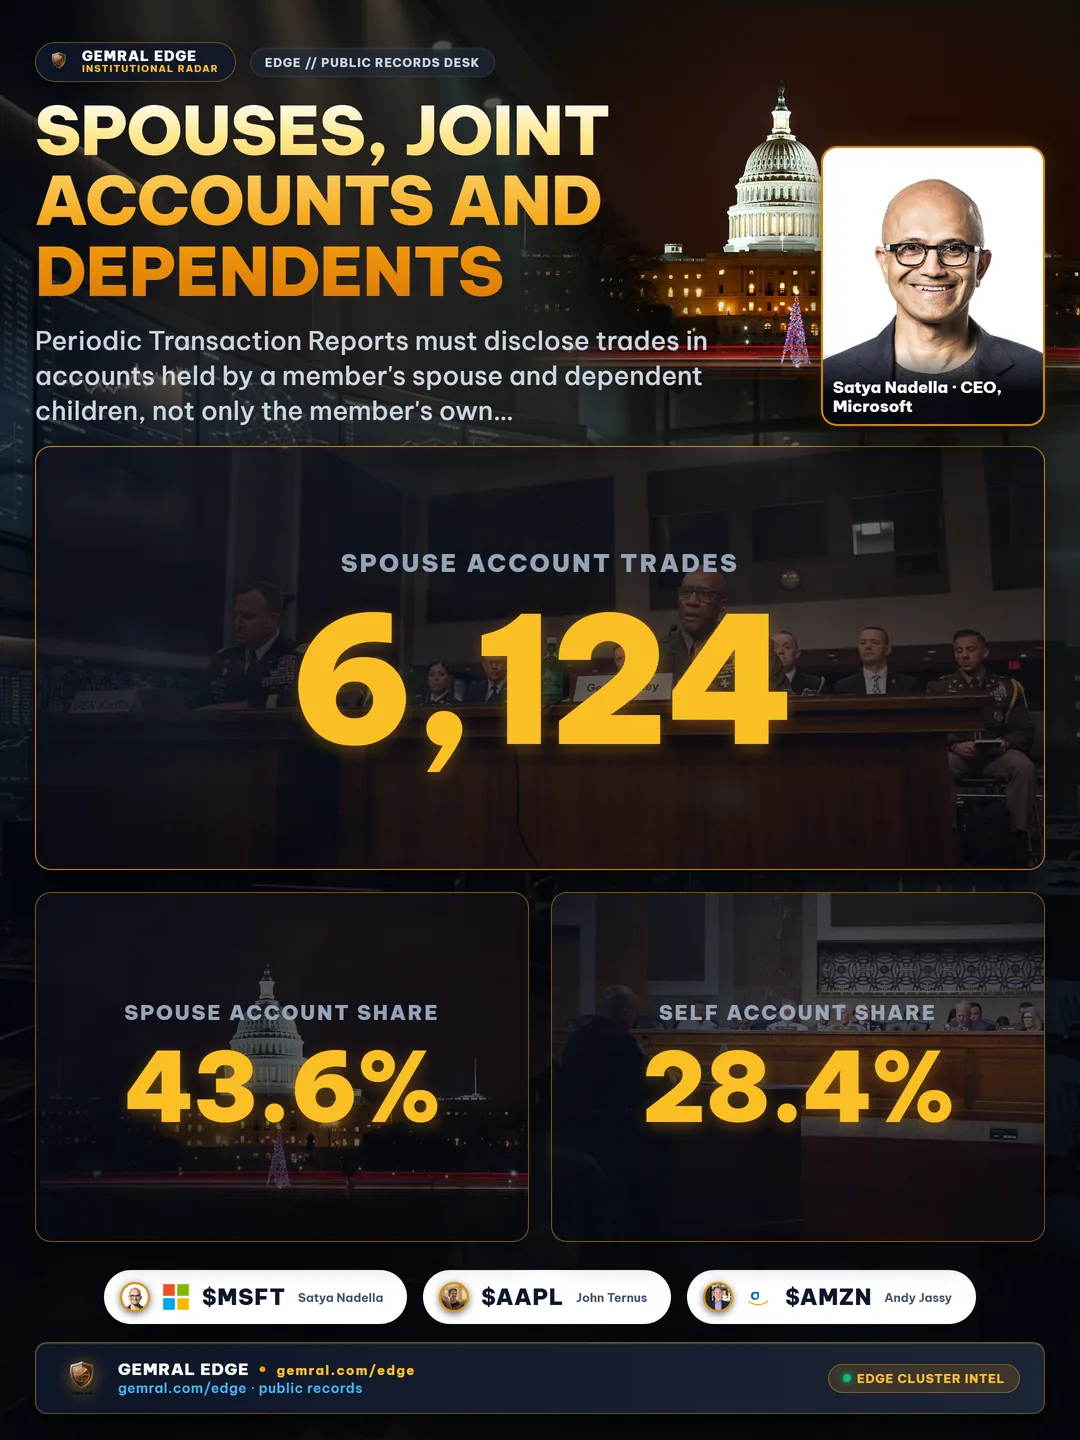
Periodic Transaction Reports must disclose trades in accounts held by a member's spouse and dependent children, not only the member's own accounts. In 2025, most of the House's stock trades fell into those other categories.
| Account owner listed on the filing | Trades | Share |
|---|---|---|
| Spouse | 6,124 | 43.6% |
| Member (self) | 3,998 | 28.4% |
| Dependent child | 2,532 | 18.0% |
| Joint | 1,406 | 10.0% |
Taken together, 10,062 trades, or 71.6% of the year, were made in an account that was not the member's alone. That number is central to the policy debate. Some of the trading-ban bills introduced in recent sessions would extend restrictions to spouses and dependents, while others would cover only the member. A ban limited to the member's own accounts would, on 2025 numbers, have left 10,062 of 14,060 trades outside its scope. For the current state of those bills, see our explainer on the congressional stock trading ban debate.
The dependent-child category is almost entirely one party's: 2,528 of the 2,532 dependent-account trades were reported by Democratic members, most of them in accounts disclosed by Rep. Khanna. A single family's accounts can therefore change the ownership mix of a whole chamber, which is another reason to read chamber-wide shares with the member table beside them.
The Reporting Clock: How Fast Members Disclosed Their Trades
The STOCK Act of 2012 requires members to report a covered transaction within 30 days of learning about it, and in no case later than 45 days after the transaction itself. We measured the gap between each trade and the date the House Clerk recorded the filing, for all 14,060 House trades dated in 2025.

| Days from trade to filing | Trades | Share |
|---|---|---|
| 30 days or fewer | 8,932 | 63.5% |
| 31 to 45 days | 3,972 | 28.3% |
| More than 45 days | 1,156 | 8.2% |
The median trade was filed 27 days after it happened, and 91.8% of trades were filed inside the 45-day line. The 1,156 trades past that line, 8.2% of the year, came from 38 members. Most of that total sits in catch-up filings, where a member reports months of trades in a single document: 939 of the 1,156 late trades come from filings that each contain 50 or more of them.
We are deliberately careful here. A filing date past 45 days is not, on its own, proof of a violation: amendments that correct an earlier timely report, and trades the member legitimately learned about later, can both produce a long gap. We are therefore not naming individual members in this section. Journalists who want to examine a specific case can match any trade to its original PDF on the House Clerk's disclosure site, where the filing date is printed on the document. For background on how the reporting window works in practice, our guide to how congressional stock disclosures work walks through the 30-day and 45-day rules.
Small Tickets, Big Totals: The Dollar Bands Behind 2025 Trades
The image of congressional trading as a stream of large, well-timed bets does not match most of the record. 10,794 of the 14,060 House trades, 76.8%, were reported in the lowest band, $1,001 to $15,000. Another 1,989, or 14.1%, sat in the $15,001 to $50,000 band.

| Reported amount band | Trades |
|---|---|
| $1,001 to $15,000 | 10,794 |
| $15,001 to $50,000 | 1,989 |
| $50,001 to $100,000 | 590 |
| $100,001 to $250,000 | 453 |
| $250,001 to $500,000 | 131 |
| $500,001 to $1,000,000 | 52 |
| $1,000,001 to $5,000,000 | 28 |
| $5,000,001 to $25,000,000 | 12 |
| $25,000,001 to $50,000,000 | 1 |
Only 224 trades in the entire year were reported in bands above $250,000. Those 224 trades, however, carry a large share of the estimated dollar value, which is why the midpoint total of about $664.2 million is driven far more by a few large tickets than by the 10,794 small ones. When a story leads with the dollar value of congressional trading, it is mostly describing a few hundred trades; when it leads with trade counts, it is mostly describing small, frequent rebalancing.
The band system itself limits what anyone can say. A trade reported as $1,001 to $15,000 could be worth $1,001 or $15,000, a 15-fold range. Until disclosure rules require exact amounts, any total value figure for congressional trading, including ours, is an estimate.
Methodology and Limitations
This study covers stock transactions reported on Periodic Transaction Reports by members of the U.S. House of Representatives, with a transaction date between January 1, 2025 and December 31, 2025, as recorded in our congressional trading dataset on October 14, 2026. We read the House Clerk's annual filing index for 2025 and 2026, opened every Periodic Transaction Report listed there, and matched each filer to a member by state, district and name. Electronic filings were read from their text layer. Paper filings, which arrive as scanned images, were transcribed page by page and each row was checked against the filing's own dates. Each transaction keeps a link to its source filing.
- Scope: House members only. Senate transactions dated in 2025 number 58 in our records, too few for a fair comparison, and are excluded.
- Counting: Each line item on a filing counts as 1 trade. A member who buys the same stock twice on different days appears twice.
- Value: Dollar figures use the midpoint of each reported band. They are estimates, not exact amounts.
- Timing: Days to filing are measured from the transaction date to the filing date recorded by the House Clerk.
- Tickers: 3,168 trades, mostly from paper filings, carry no ticker because the filing names the company without one.
- Late filings and corrections: Trades from 2025 that are reported after October 14, 2026 are not included. Counts can change slightly as late reports and amendments arrive.
- No inference about intent: Disclosure filings record that a trade happened. They do not record who made the decision or why. Nothing in this study suggests any member traded on non-public information.
Reporters and researchers who want the underlying tables for a story, including per-member and per-ticker breakdowns for 2025, can request them through the congressional trading tracker, or browse the live member-by-member view at Gemral Edge congressional intelligence. Individual filings can be verified on the House Clerk financial disclosure search, and the text of the STOCK Act is available on Congress.gov.
Disclaimer: Public data · not investment advice. This study describes transactions reported in public congressional disclosure filings for research and journalism. It makes no recommendation to buy or sell any security and makes no allegation of wrongdoing by any member of Congress.
Frequently asked questions
How many stock trades did members of Congress make in 2025?
House members reported 14,060 stock trades with 2025 transaction dates, from 113 members: 7,010 purchases, 7,024 sales and 26 exchanges. Senate trades in our records number only 58 from 5 senators, so the study covers the House.
Which member of Congress traded the most stocks in 2025?
Rep. Ro Khanna (D-CA) reported 4,859 trades across 839 securities, 34.6% of all House stock trades in 2025, almost all in spouse and dependent-child accounts. By estimated dollar value, Rep. Jefferson Shreve (R-IN) led with about $180.9 million in midpoint value across 627 trades.
What stocks did Congress trade most in 2025?
Microsoft and Apple were each traded by 31 House members, followed by Amazon (27), and Nvidia and Procter & Gamble (23 each). Nvidia leaned to the buy side: 99 purchases against 42 sales, bought by 18 members.
Did members of Congress buy or sell during the April 2025 tariff selloff?
They sold more than they bought. Between April 3 and April 8, 2025, House members reported 786 trades from 21 members, 443 sales and 343 purchases. In the following week they reported 535 trades, 335 of them sales.
How many congressional stock trades were reported late in 2025?
1,156 of 14,060 House trades, or 8.2%, were filed more than 45 days after the transaction, from 38 members. The median trade was filed 27 days after it happened. A long gap alone does not prove a violation, because amendments and late notice can produce it.