
Public federal budget authorizations under the National Defense Authorization Act reached $895.2 billion for fiscal year 2026, anchoring more than $431.8 billion in direct prime contract obligations across Department of Defense acquisition commands. For institutional investors analyzing defense contractor stocks, statutory procurement appropriations represent multi-year sovereign revenue commitments that operate independently of consumer discretionary spending cycles.
Unlike commercial industrial corporations that rely on volatile commercial order books, major defense prime contractors operate under legally binding federal contract awards. Tracking public contract obligation records, program budget line items, and corporate order backlogs provides transparent visibility into forward earnings stability. This procurement pipeline links congressional budget votes directly to corporate revenue recognition across 5 to 7 year delivery schedules.
Much like evaluating prime award distributions via our government contracts tracker or reviewing historical contractor rankings in our top defense contractors by revenue analysis, mapping statutory award obligations reveals structural capital concentration across aerospace and defense equities.
How Defense Contractor Stocks Derive Revenue from Federal Contract Obligations
Public defense contractor stocks derive their fundamental valuation from statutory procurement obligations disbursed across federal military services. The top 5 defense prime contractors—Lockheed Martin (LMT), RTX Corporation (RTX), General Dynamics (GD), Northrop Grumman (NOC), and Boeing (BA)—collectively account for 53.4% of total prime contract obligations awarded by the Department of Defense.
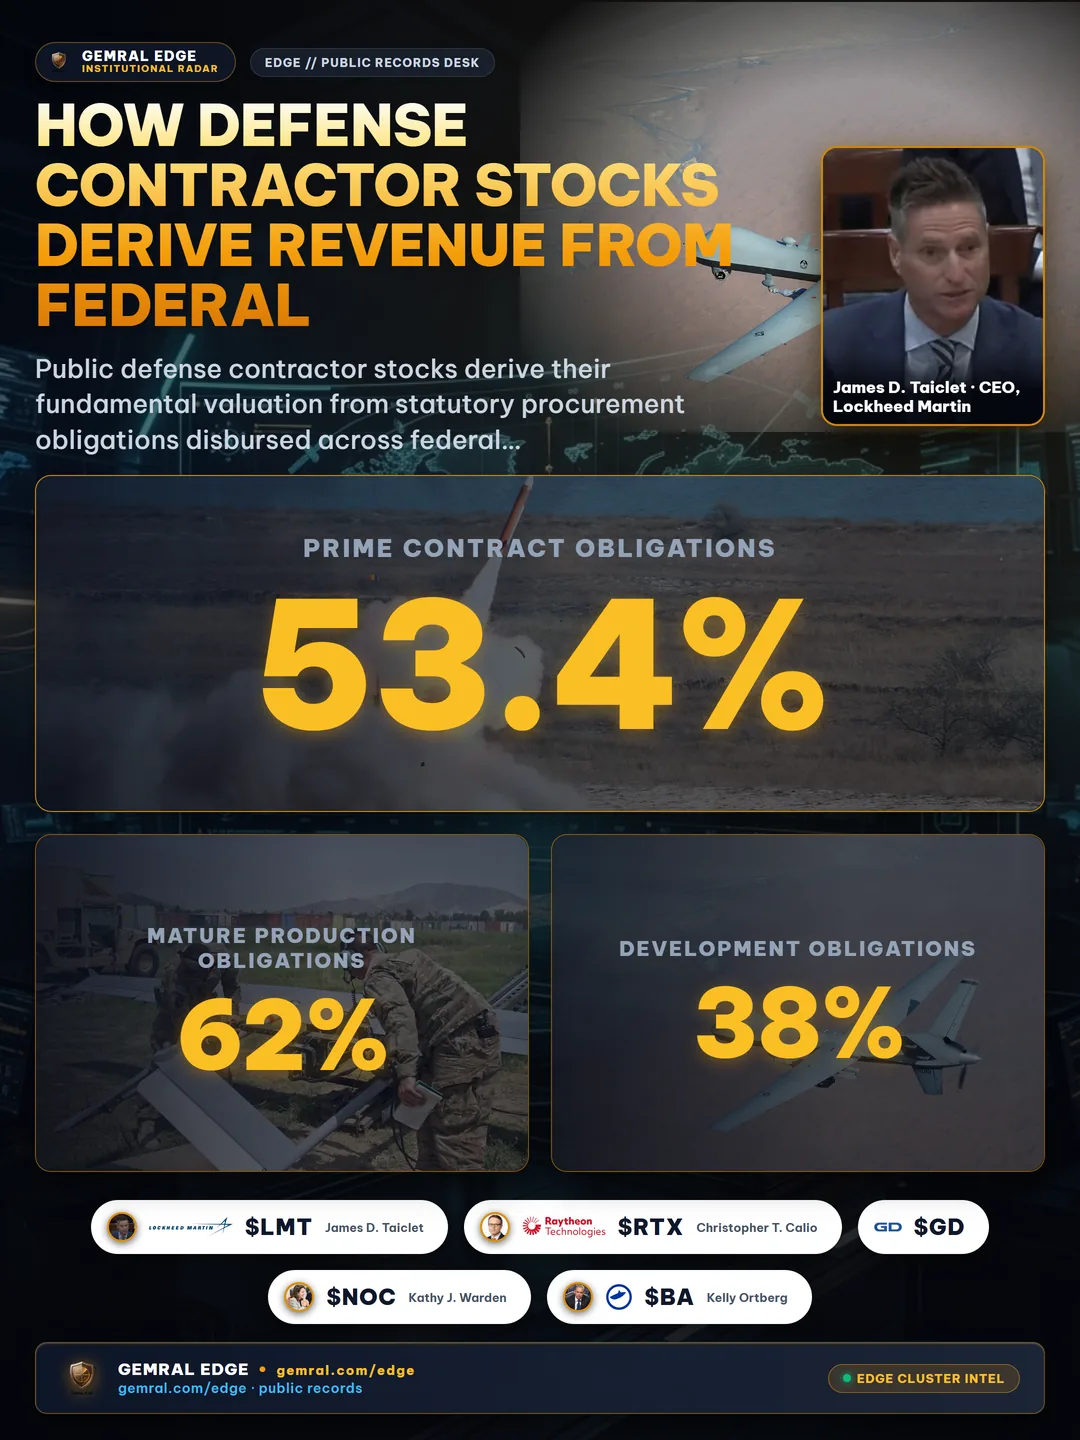
Federal defense contracting operates under strict statutory procurement regulations codified in the Federal Acquisition Regulation (FAR) and Defense Federal Acquisition Regulation Supplement (DFARS). Prime awards fall into two primary structural contract mechanisms:
- Firm-Fixed-Price (FFP) Contracts: Accounting for approximately 62% of mature production obligations, FFP contracts place operating cost discipline on the prime contractor while guaranteeing fixed unit revenue once hardware milestones are achieved. Mature production runs, such as the F-35 Lightning II or Guided Multiple Launch Rocket Systems (GMLRS), transition into FFP structures to protect sovereign purchasing power.
- Cost-Plus and Incentive-Fee (CPIF) Contracts: Representing approximately 38% of development obligations, cost-reimbursement awards insulate defense primes against developmental cost overruns on experimental systems, including the B-21 Raider long-range strike bomber and next-generation hypersonic glide interceptor prototypes.
When public acquisition authorities issue formal contract obligations, the funds are legally committed by the United States Treasury. This sovereign guarantee eliminates counterparty credit default risk, establishing defense contractor receivables as high-grade corporate assets throughout macroeconomic downturns.
Deconstructing Pentagon Budget Allocations and Multi-Year Program Procurement Cycles
The translation of congressional intent into corporate defense revenue follows a structured multi-year appropriations framework. Every defense procurement program navigates a formal multi-stage budgetary lifecycle:

- Authorization Phase: The annual National Defense Authorization Act (NDAA) establishes statutory policy guidelines, force structure ceilings, and authorized spending caps, totaling $895.2 billion in baseline national defense authorizations for fiscal year 2026.
- Appropriations Phase: Congressional defense appropriations bills formally deposit capital into Department of Defense procurement and Research, Development, Test and Evaluation (RDT&E) budget accounts across 4 distinct quarterly tranches.
- Obligation Phase: Service procurement commands execute binding contracts with prime vendors, converting appropriated taxpayer capital into legally binding contract obligations.
- Outlay and Liquidation Phase: Prime contractors deliver military hardware, software mission systems, or sustainment services over 5 to 7 year timelines, drawing down Treasury funds upon documented acceptance.
The table below illustrates the capital distribution and operational profiles of the top 5 publicly traded defense prime contractors:
| Defense Contractor | Ticker | Funded Backlog ($B) | Book-to-Bill | Primary Defense Weapon Programs |
|---|---|---|---|---|
| Lockheed Martin | LMT | $165.7 | 1.18 | F-35 Fighter Jet, PAC-3 Missile Defense, HIMARS Rocket Artillery |
| RTX Corporation | RTX | $92.4 | 1.15 | Patriot Air Defense System, AMRAAM Air-to-Air, SPY-6 Naval Radar |
| General Dynamics | GD | $91.4 | 1.08 | Columbia-class Ballistic Submarines, Virginia-class Attack Subs, Abrams M1A2 |
| Northrop Grumman | NOC | $85.3 | 1.12 | B-21 Raider Stealth Bomber, Sentinel ICBM Modernization, Space Systems |
| Boeing Defense and Space | BA | $62.1 | 1.0 | KC-46A Pegasus Aerial Tanker, P-8A Poseidon Maritime Patrol, F-15EX Fighter |
Because major acquisition programs require multi-year procurement authorizations, funding cancellations are rare once a weapon system enters rate production. This institutional dynamic produces high forward revenue certainty across multi-year fiscal horizons.
Evaluating Prime Contractor Revenue Backlogs and Book-to-Bill Ratios
The fundamental financial health of defense contractor stocks is measured through order backlog volume and the book-to-bill ratio. Together, the top 5 prime contractors maintain a combined order backlog of $610.9 billion, representing more than 24 months of aggregate corporate manufacturing output.

The book-to-bill ratio measures the dollar value of gross contract obligations received relative to recognized corporate revenues over a trailing 12-month period:
- Book-to-Bill Ratio > 1.0: Demonstrates that incoming contract awards exceed production billings, resulting in net order backlog expansion. Lockheed Martin reported a book-to-bill ratio of 1.18, driven by international F-35 orders and replenishment contracts for tactical precision munitions.
- Book-to-Bill Ratio = 1.0: Reflects steady-state execution where replacement awards match historical run-rate deliveries, ensuring baseline cash flow predictability.
- Book-to-Bill Ratio < 1.0: Suggests potential forward revenue contraction or program delivery maturity, prompting management teams to bid on replacement franchise programs.
At RTX Corporation, the total company backlog stands at $206.0 billion, including commercial aerospace lines and $92.4 billion in dedicated defense orders with a defense book-to-bill ratio of 1.15. At General Dynamics, submarine construction commitments for the U.S. Navy support a funded backlog of $91.4 billion and a book-to-bill ratio of 1.08. Meanwhile, Northrop Grumman holds an $85.3 billion backlog with a 1.12 book-to-bill ratio, fortified by classified stealth contracts and strategic deterrence programs.
Defense Contractor Dividend Sustainability, Cash Flow Conversion, and Tier-One Flow-Downs
For equity market participants seeking defensive cash yields, defense contractor stocks offer documented dividend consistency supported by federal progress payments. Unlike commercial software or consumer hardware vendors that face product obsolescence cycles, defense primes operate with predictable government progress payments disbursed every 30 to 60 days upon certified project completion.
This cash flow mechanics directly underpins shareholder returns and capital distribution:
- Lockheed Martin (LMT): Maintains a dividend yield of approximately 2.4%, backed by steady free cash flow conversion and 22 consecutive years of statutory dividend increases.
- RTX Corporation (RTX): Provides a dividend yield of 2.1%, supported by balanced cash flow generation across military missile defense systems and commercial aviation aftermarket services.
- General Dynamics (GD): Delivers a dividend yield of 1.9%, supported by multi-decade naval shipbuilding contracts and high-margin combat vehicle modernization programs.
- Northrop Grumman (NOC): Generates a dividend yield of 1.7%, characterized by high return on invested capital and multi-year program execution across space exploration and strategic deterrence systems.
Beyond the primary prime contractors, federal procurement obligations trigger broad tier-one subcontractor flow-downs. When the Pentagon awards a major airframe contract to Lockheed Martin or a missile contract to RTX Corporation, statutory subcontracting plans require that tens of billions of dollars flow downward into propulsion providers, specialized electronic warfare suppliers, and precision machining facilities across the domestic industrial base.
By systematically monitoring public contract obligation filings, federal budget appropriations hearings, and prime contractor backlog filings, institutional analysts and market participants can track the velocity of sovereign defense spending with quantifiable rigor across entire economic cycles.
Public data · not investment advice. All company names, contract numbers, and budget figures cited are from public Department of Defense and federal appropriations records.
Frequently asked questions
What are defense contractor stocks and how do they generate revenue?
Defense contractor stocks represent publicly traded corporations that develop, manufacture, and sustain defense systems, weaponry, aerospace platforms, naval vessels, and mission systems for the United States government and allied foreign militaries. Their revenues are directly derived from statutory federal contract obligations authorized under the annual National Defense Authorization Act (NDAA) and disbursed through Defense Department procurement and research accounts.
How do Pentagon budget appropriations translate into defense company backlogs?
Pentagon budget appropriations flow through a structured multi-year cycle: Congress authorizes programs via the NDAA and funds them through defense appropriations acts. Military branches then obligate funds by awarding prime contracts (such as firm-fixed-price or cost-plus contracts). Unperformed portions of these awarded contracts enter the prime contractor backlog, creating transparent revenue visibility stretching across 5 to 7 years.
What does a defense contractor book-to-bill ratio signify?
The book-to-bill ratio compares the dollar value of gross orders and contract awards received during a period to the revenue recognized over that same period. A book-to-bill ratio above 1.0 indicates that incoming contract obligations exceed current fulfillment, signaling that the company backlog is expanding and ensuring forward revenue growth.
Why are defense contractor stocks traditionally viewed as defensive investments?
Defense contractor stocks are supported by counter-cyclical government spending, statutory sovereign funding, and legally binding contract obligations that persist regardless of macroeconomic recessions or consumer demand cycles. Furthermore, high barriers to entry, classified program access, and strong operating cash flows enable mature primes to maintain long track records of consistent dividend growth and share repurchases.